Thesis: Analysis of Embryo Genetic Scores
This thesis was presented in the Faculty of Exact and Natural Sciences of the University of Buenos Aires (UBA) in 2022. It’s a Bioinformatics and Biostatistics analysis of several kinds of genetic scores associated to disease, mainly utilised to diagnose embryos during in vitro fertilization.
Some results and figures are showcased here.
Theoretical description of genetic data under different disorders
We described the expected distribution of a genetic data statistic called BAF under different disorders and levels of mosaicism, which means different percentages of mutated cells in a sample.

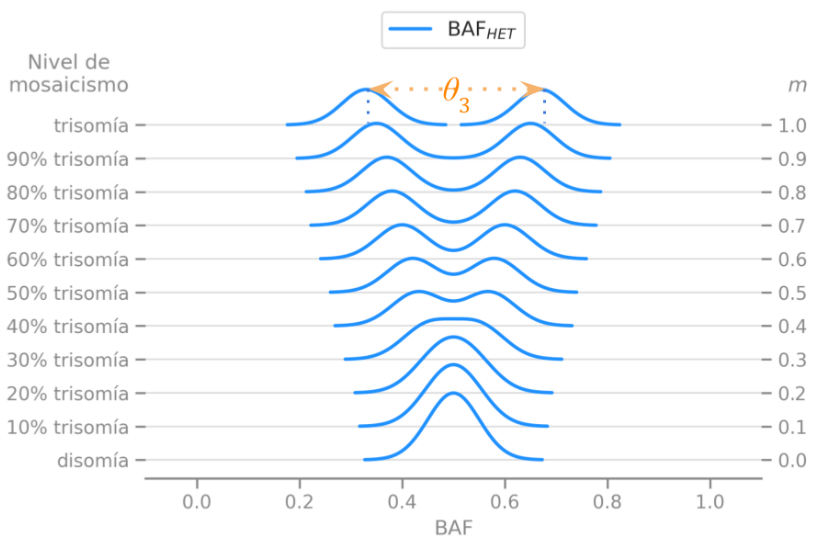
We described the expected behavior of a single measure $\theta$ that helped designing statistical tests to easily detect these disorders.
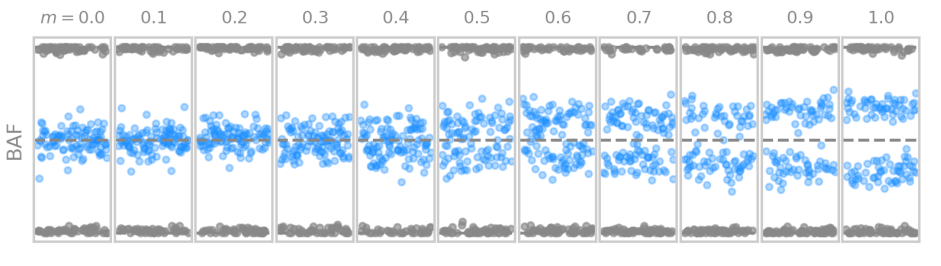
Simulation of genetic data with different degrees of mosaicism
We simulated genetic data for different levels mosaicism, based on the theoretical framework developed for the thesis.

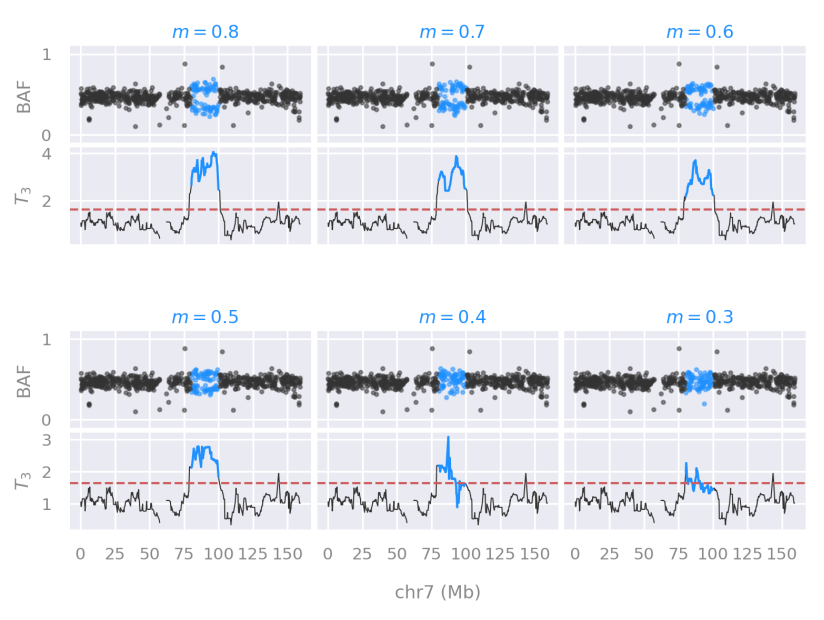
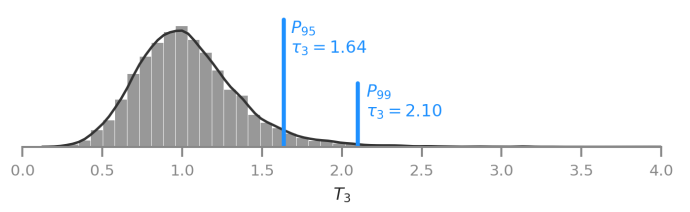
Performance and empirical distribution of a new statistic
We developed and described a new statistic to detect aneuploidies in embryos, leveraging on a robust measure of dispersion called median absolute deviation (MAD).
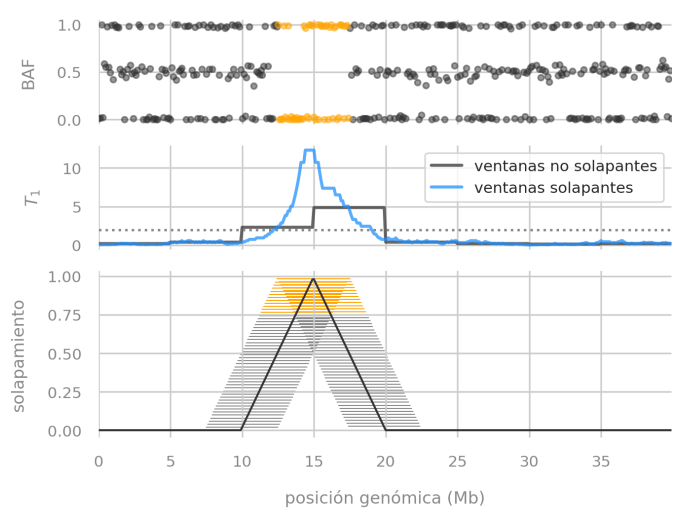
Performance of testing with overlapping-windows of data
We described a problem with non-overlapping windows of data when searching for genetic disorders that span few megabases in a chromosome (that means, mutations that span a relatively small region).
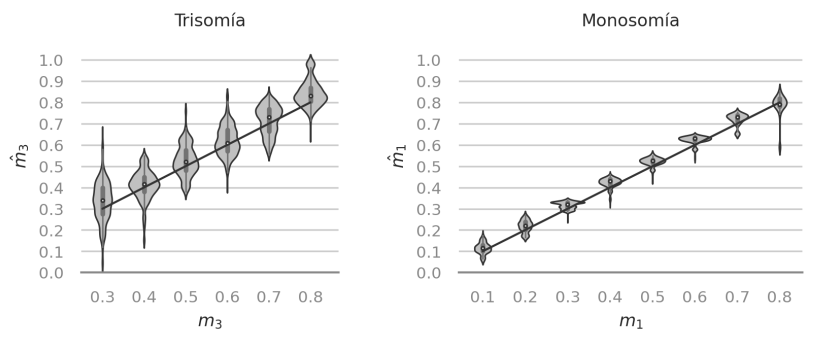
Estimator performance evaluation
We evaluated the performance of a new estimator of the level of mosaicism with simulated embryo samples.
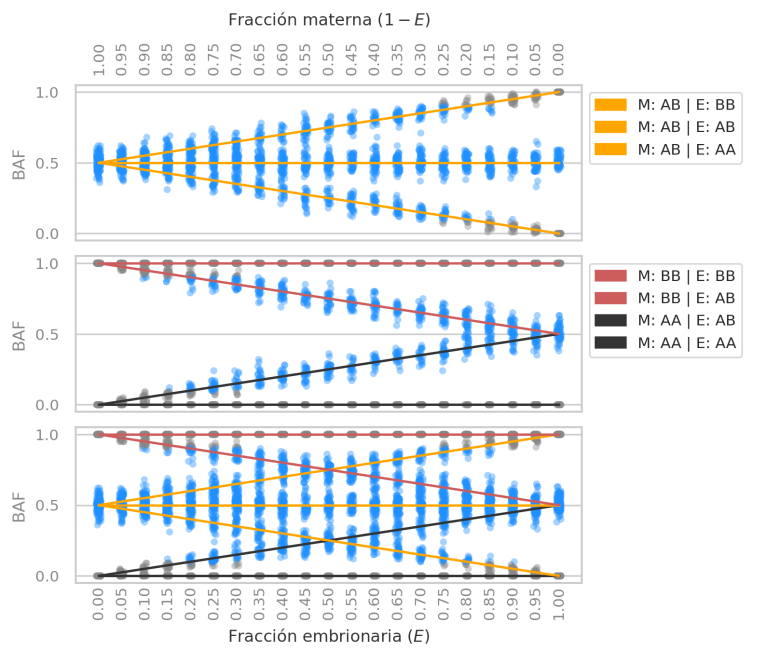
Complex patterns of DNA contamination
We analyzed the BAF statistic under different levels of DNA mixture (or “contamination”) between mother and embryo.
Genomic panel target distribution
We analyzed the distribution of “probes” or targets in a genomic panel, with emphasis in the distribution of the size of the gaps with no data left by the panel.

Anticorrelation between Polygenic Risk Scores
We analyzed the correlation of Polygenic Risk Scores (PRS), a kind of genetic score computed from hundreds or thousands of mutations in the genome. We found several pairs of diseases, like rheumatoid arthritis and multiple sclerosis, with negatively correlated scores. An example is given in the figure below.

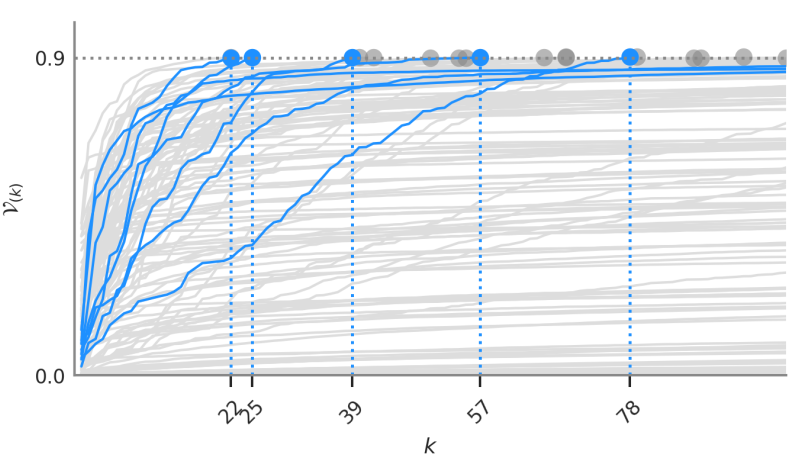
Variance trajectories of sub-scores
We analyzed the proportion of variance $\mathcal{V}_{(k)}$ captured by the genetic scores when keeping sub-selections of the $k$ strongest-effect mutations. These captured-variance trajectories help quantify the degree of polygenicity of a given disease. Low polygenicity means that few mutations determine most of the risk.
Graph of diseases with correlated genetic risk
We found a surprising “natural” grouping of autoimmune diseases based on the correlation between their polygenic scores.

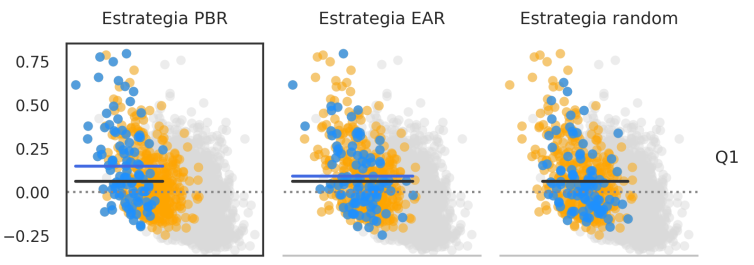
Simulation of embryos and performance of embryo-selection strategies
We simulated genetic data from embryos and analyzed the results of selecting embryos based on their genetic scores. A potential problem was described where embryos with low genetic score of one disease might have increased risk of a correlated disease.
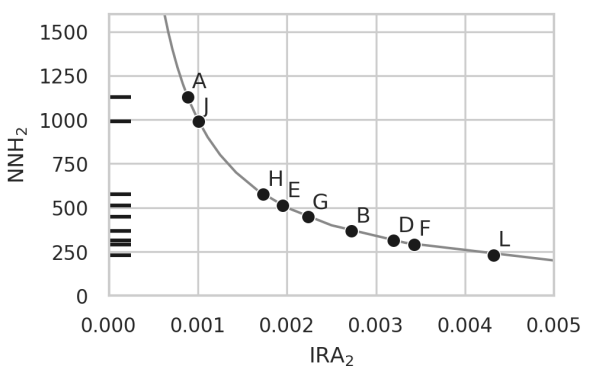
Relation between increase in risk and number needed to harm
A knwon metric in epidemiology called Number Needed to Harm (NNH) is plotted against the increase in absolute risk (IRA) for several pairs of anticorrelated diseases. This illustrates that between 250 and 1250 couples applying a PRS-based embryo selection might be enough to produce unwanted new cases of some diseases.
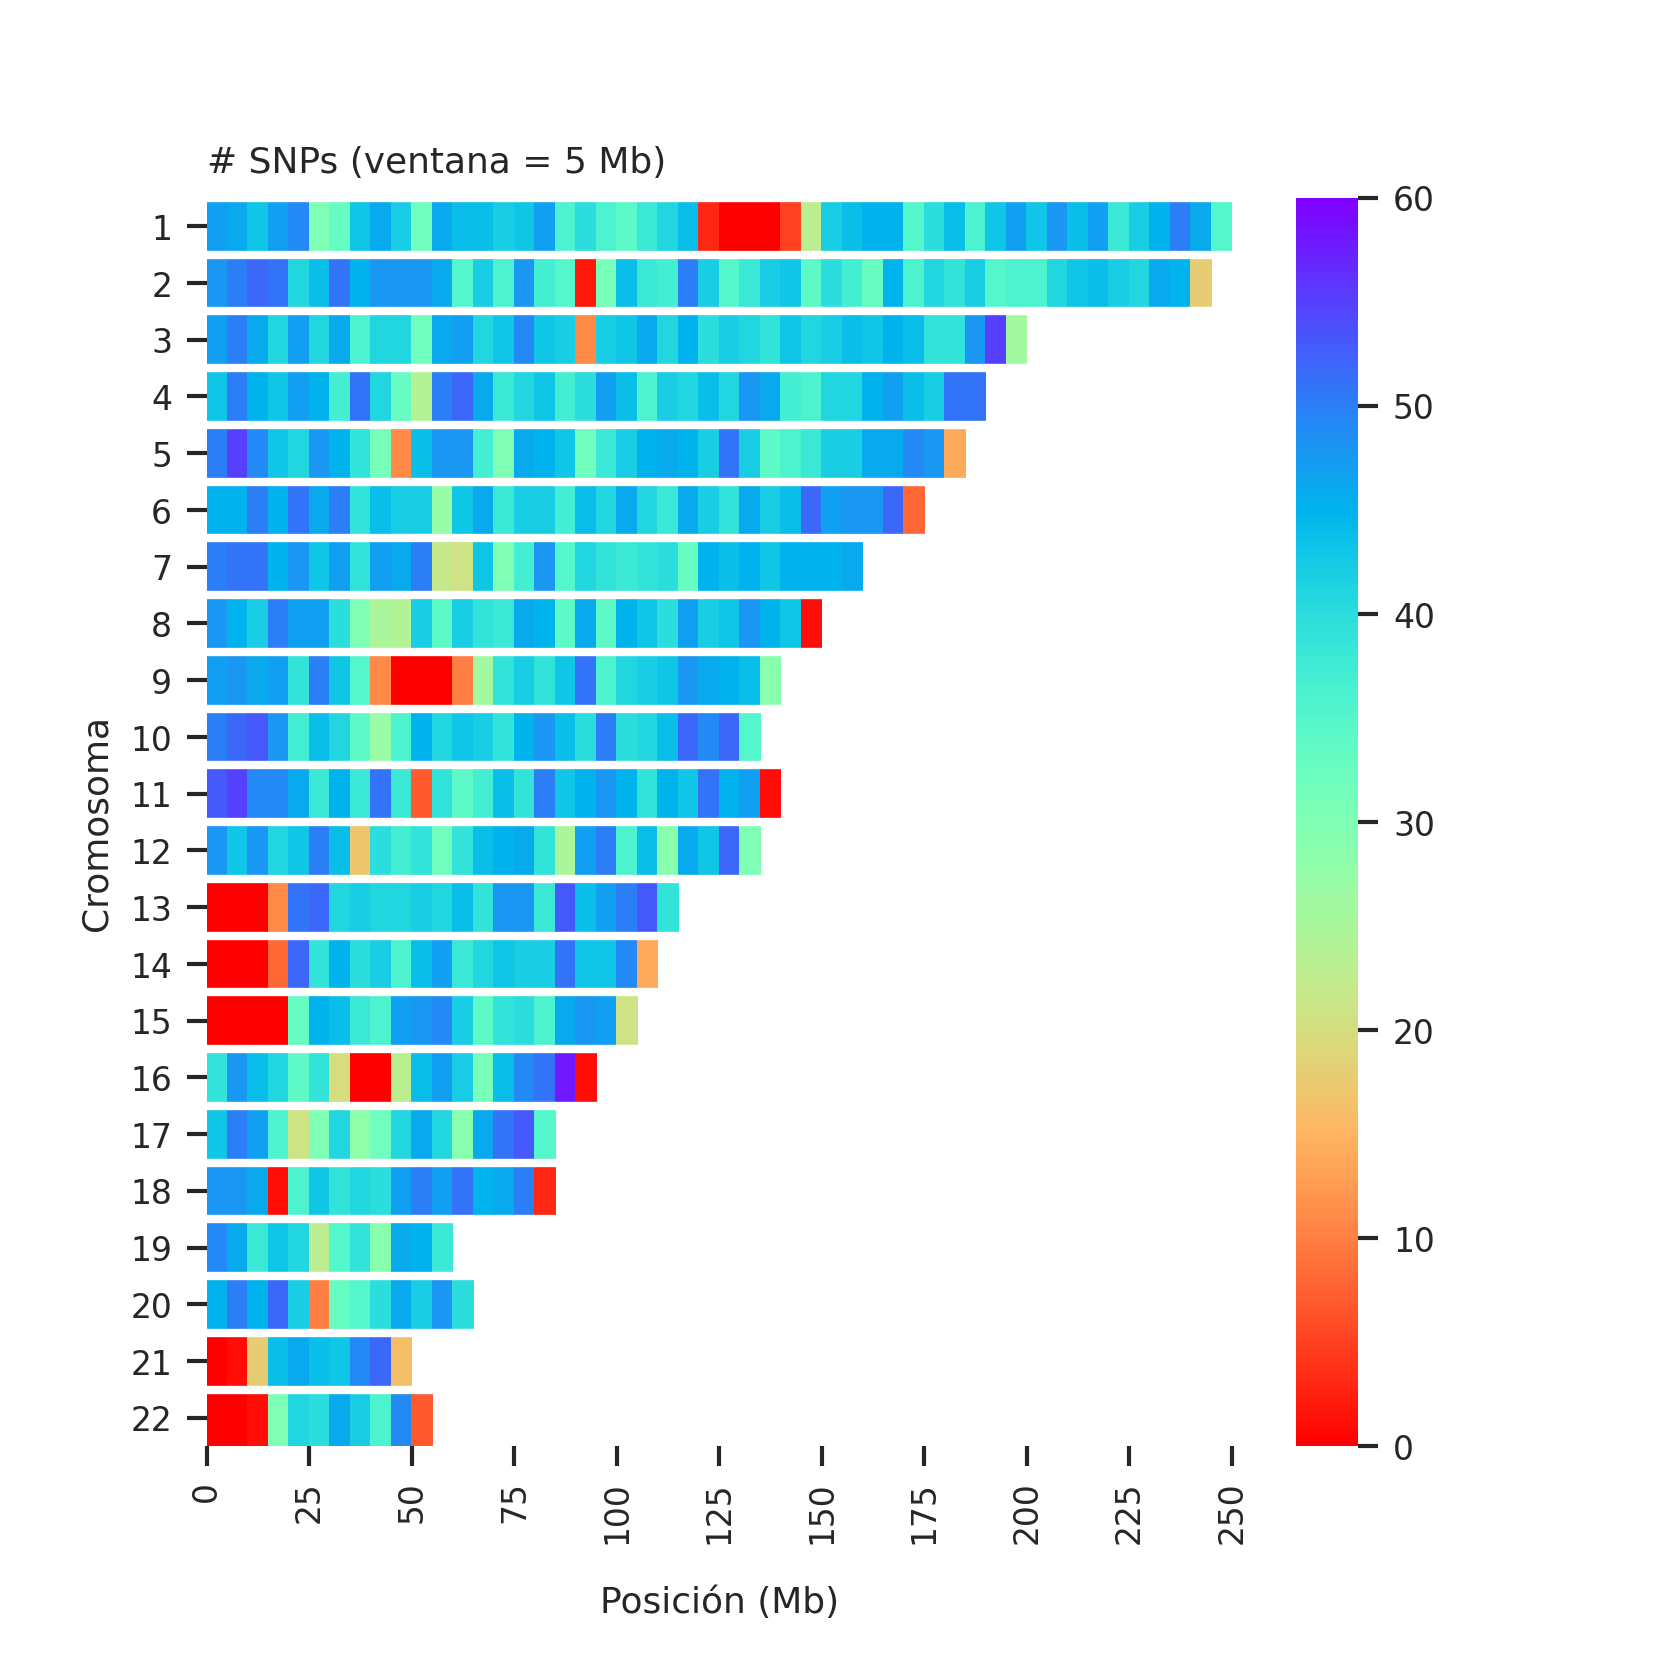
Heatmap of number of datapoints per genomic region
The number of SNPs in each window of 5 Mb (megabases, a kind of genetic distance) are plotted, which can be thought of as the number of datapoints for a given test.