Streamlit Data Explorations
This work for a client involved rapid prototyping of internal data exploration apps leveraging on a huge Snowflake database as resource and Streamlit as a tool to produce interactive visualizations.
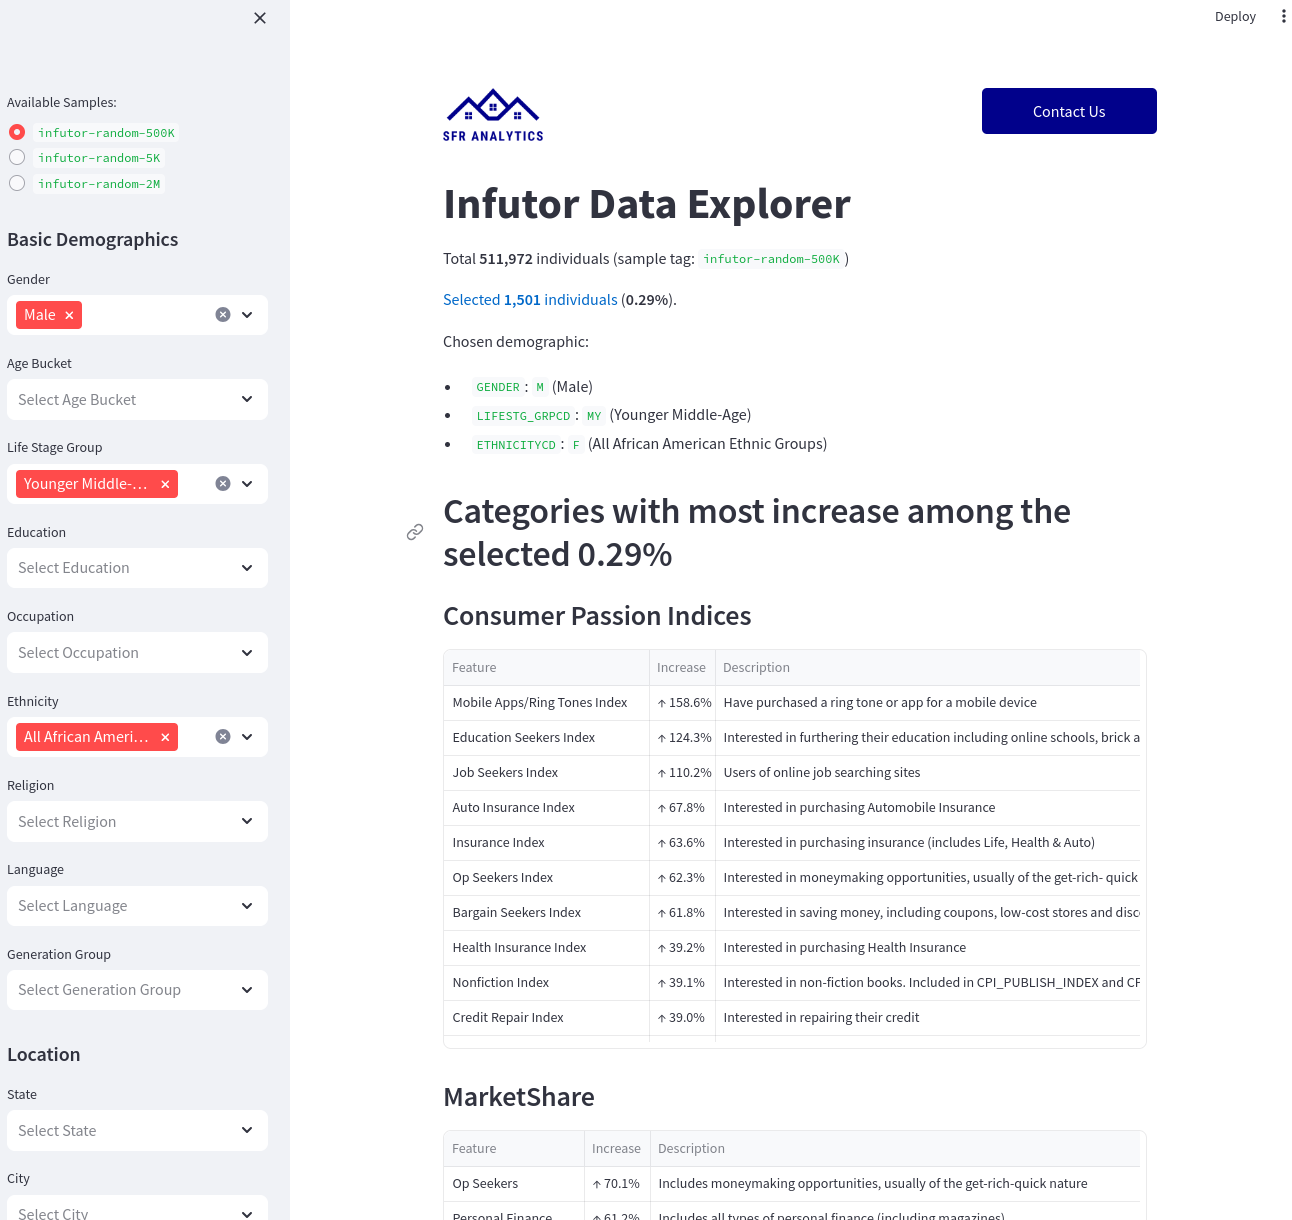
One exploration involved diving deep into a dataset of socioeconomic, demographics,
personal, and consumer information (Infutor). The
Snowflake table had 250m rows, so random samples were extracted and processed in real
time, from user interaction, with the help of polars, a dataframe library that can be
many times faster than pandas.
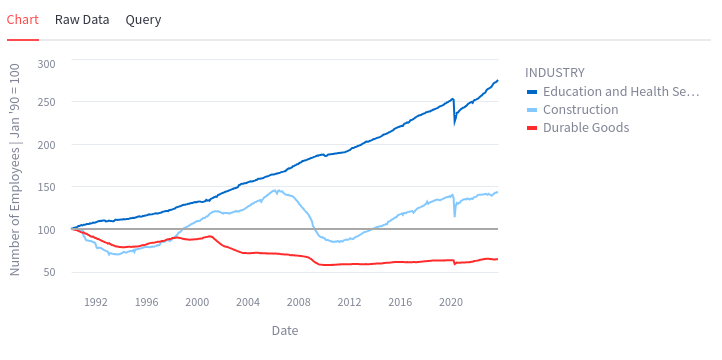
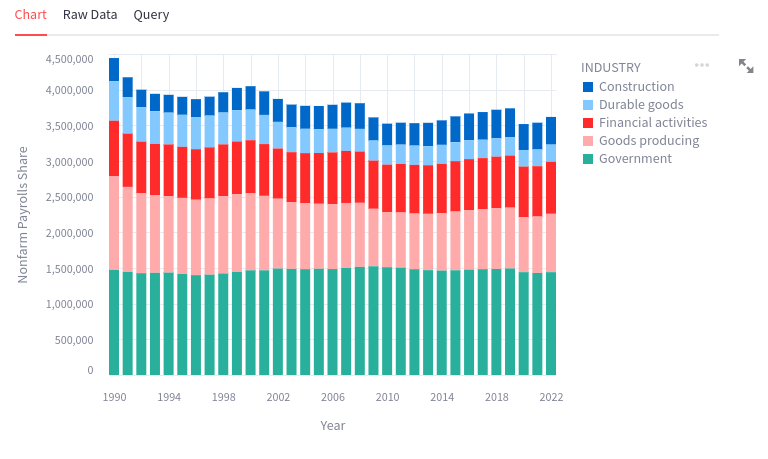
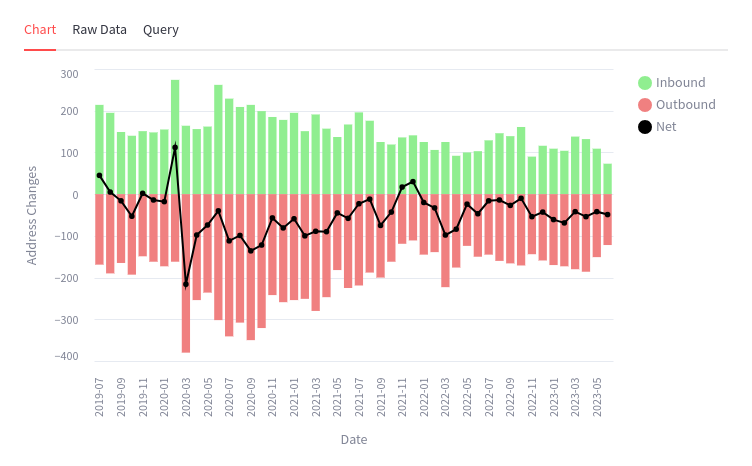
Another exploration involved a collection of tables from Cybersyn, comprising multiple timeseries from the Bureau of Labor Statistics, the Federal Reserver Economic Data, USPS addresses and address changes. Here, the solution involved interactively querying Snowflake to produce up-to-date plots with several parameters that the user could modify –i.e. normalized or unnormalized variables, seasonal adjustment, custom aggregation of industry types, and arbitrary combinations of cities, metropolitan areas, or states.