Data Modeling Projects
Cargo Data Analysis - Interactive EDA
For this project, the client had a data challenge to quickly analyze a dataset of sites where cargo accumulates over time and is picked up according to different signals –a mixture of automatic pickups and scheduled pickups.
We needed to visualize if there was room for improvement in the scheduling of cargo pickup times.
The interactive visualization (done entierely with matplotlib and Jupyter
IPywidgets, after some data analysis with pandas) shows that a lot of
pickup times are either quite delayed or too early
in contrast with the scheduled times. If a
maximum cargo capacity of the site is plotted at 200K, we can see that almost all pickup
schedules could be delayed a bit, until more cargo is accumulated.
The information is evidently noisy, but a pattern emerges and there seems to be room for improvement of the pickup scheduling.
This challenge –both the analysis and the interactive prototpye– was completed in around three days of work:
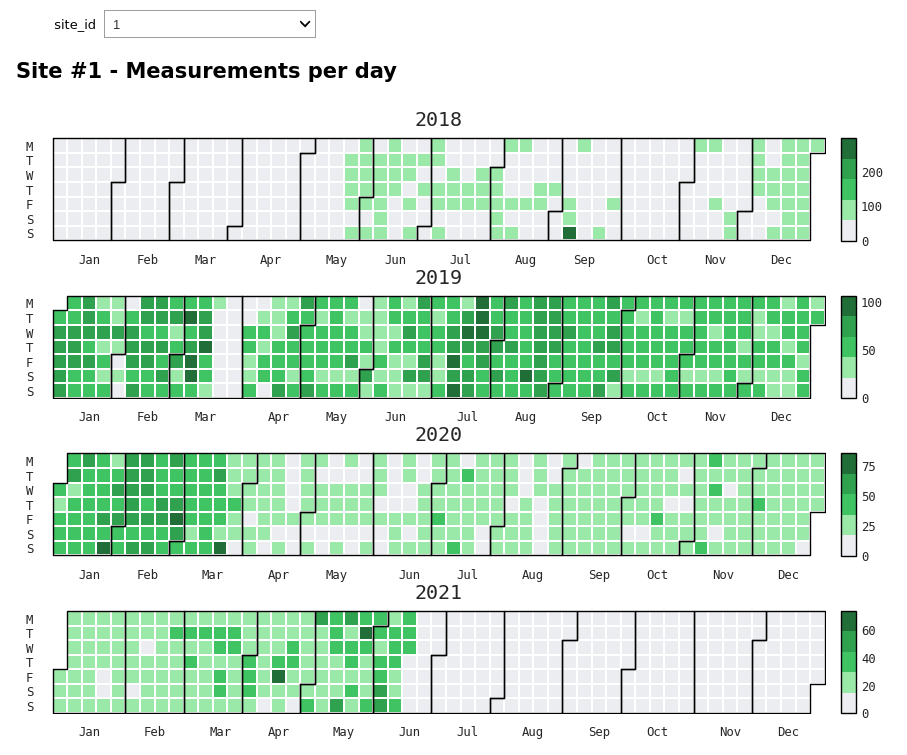
Another useful visualization was provided: a calendar heatmap, where we can see the number of measurements per day at each cargo site. A very irregular pattern of data availability emerges, with whole days when we have no new information:
Catch a user based on their web visits
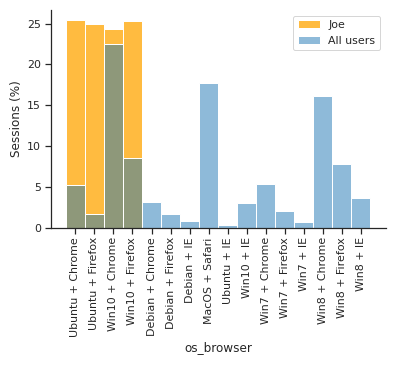
This data challenge was to model the behavior of one specific user (named Joe) based on his web visits: sites visited, time of visit, location, locale, OS, browser.
Exploratory data analysis revealed mixed visits from Linux and Windows servers
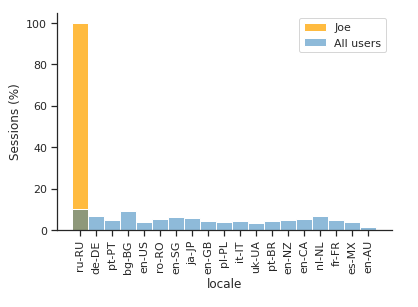
and from Chrome and Firefox browsers, while the locale was exclusively ru-RU.
The locations varied across cities, so he seemed to be a nomadic user:

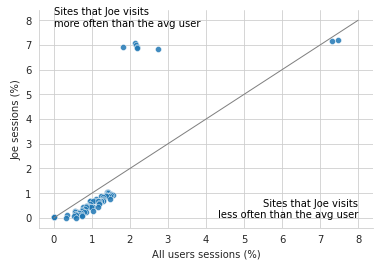
Auxiliary exploratory analysis on the websites revealed a small set of sites favorite to this user.
EDA 02: Websites visits notebook

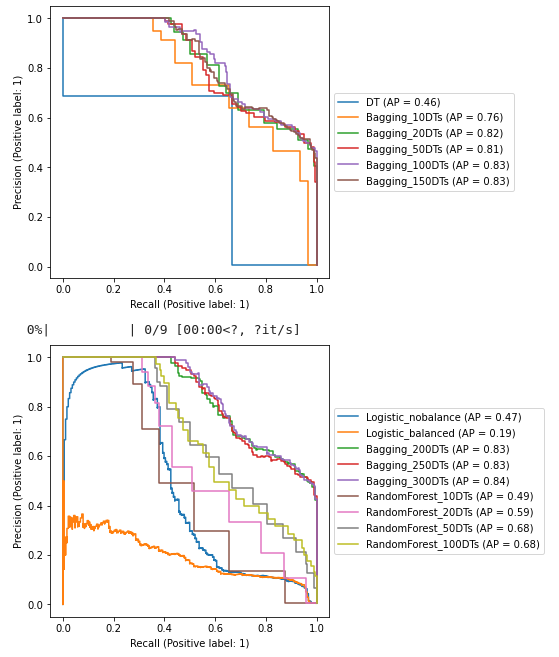
We compared several models, mostly ensemble types: Bagging DTs and Random Forests with
different parametrizations, and two types of logistic regressions. The clear winner was
the Bagging DTs as implemented by sci-kit learn. We kept a Bagging DTs model with 100
decision trees as the main hyperparameter.
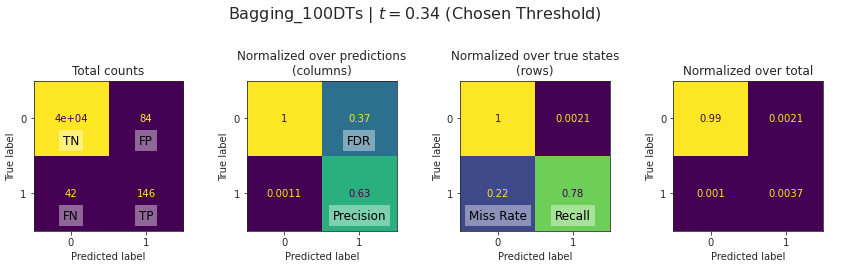
A confusion matrix, together with precision, recall, and F1-score were provided for multiple probability thresholds t.

A feature importance analysis revelaed that the locale and site of visit was the most informative piece of information, while the hour and some URLs came afterwards: